
Predicting when a competing product will be approved is essential in any commercial forecast and for any business insights team with their eye on the market. Here at OZMOSI, we have been spending our summer building out a machine learning approach to further improve our drug approval date forecasting. Typically, the industry uses a simple average of phase lengths by disease area. While we have employed a similar approach historically, with 400,000 clinical trials in our database (and counting) we feel we can do better.
In our analysis to date, we have gained some interesting perspective on the elements that go into these approval date estimates. Essentially, there are three key components driving the length of a phase:
- Recruitment timing – e., how long a company takes to acquire subjects for a study (our data on clinical facility names and counts have aided us here, along with longitudinal trial status data which helps us pinpoint the recruitment timing in relation to these facilities)
- Endpoint timing – e., how long the trial results take to collect once recruitment completes
- Company governance – e., how long a company sits on the results before taking a trial to the next phase or decision point
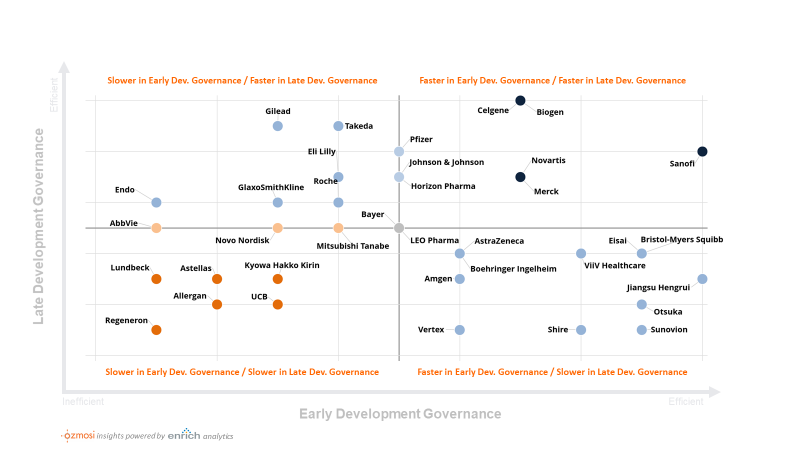
In a drill-down analysis on the third item, we explored the data along two dimensions, which we termed “Early Stage Governance” (the gap between Phase 1 results to a Phase 2 trial start) and “Late Stage Governance” (the gap between Phase 2 results and a Phase 3 trial start). Since many organizations assign early and late stage governance responsibilities to different groups, we thought it was appropriate to do the same in our analysis.
Moving forward, we plan to adapt these results to influence our machine learning approval date forecast model. In the meantime, we thought some might be interested to see where their company places along these lines. The illustration below ranks each company by how quickly they move to the next development activity. This analysis involves a robust data wrangling exercise to assign the correct trial to another in a following phase. We then measure the average inter-phase gaps by company and assign deciles.
A score of 10 designates companies at the top of their class on average. These companies will tend to even start some phases “at risk”, before the previous phase is fully completed (i.e., a negative gap). A score of 1 is assigned to the companies at the bottom decile of time to the next phase start. These companies can delay the next phase start well beyond the average “gap” timing between phases.
The difference between being in the bottom left and the top right can mean 2 to 3 years difference in approval timing, assuming recruitment- and endpoint-related timing are equal. This delay could be the difference between being the new standard of care or another “me too” drug, and could have an impact to the tune of billions of dollars across the portfolio and even for some single products (not to mention the impact on the lives of patients waiting for new treatments).
The good news is that companies have control over their governance processes and they can address this directly in their approval approach and trial planning. Furthermore, these improvements can be applied to all companies, not just the ones in the lower left. If a company can successfully change the way it does things and cut governance-related delays in half, it will generate significant value to them, their investors, and most importantly, to the patients they serve.
The chart above is just a sample of our company results. Let us know what you think – if you don’t see your company and want to know where you stand, we are happy to chat.