Pipeline portfolio reviews have never been more effortless than through our LENZ
LENZ delivers clean and clear automated portfolio views of key pharmaceutical companies and their R&D pipeline.
Discover drugs in development by:
Disease
Mechanism of Action
Country
Imagine the entire world’s pharmaceutical pipeline at your fingertips ready for you to slice and dice by company or disease area or to customize groupings to conform to your market definitions. Whether you are looking for a company pipeline competitive landscape view to compare to your portfolio or conducting a business development scan, all the data you need is waiting for you in LENZ. We provide the current list of pharmaceutical drugs from our global clinical trials data and preclinical data services for a clean list of drugs in development by company, disease, or mechanism of action (MOA).
In addition to all the relevant clinical information, we provide our best-in-class probability of success by phase and probability to launch for the compound overall. These measures of risk for the pharmaceutical pipeline include important parameters like if the drug is novel, the disease area of the trial, and company experience. Because of our indexing process, we can easily track a pharmaceutical product’s path through the clinical development cycle and even integrate news articles about that journey for some of the most robust clinical success rate measures available today.
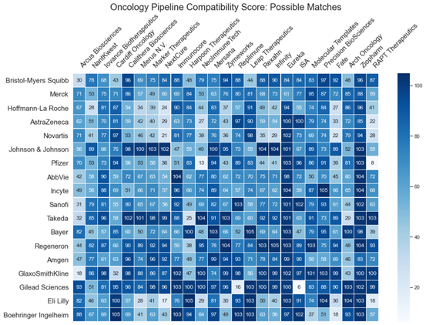
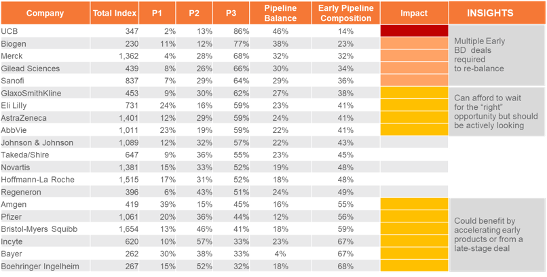
Risk-Adjusted Value Index Score by Disease Area and Company
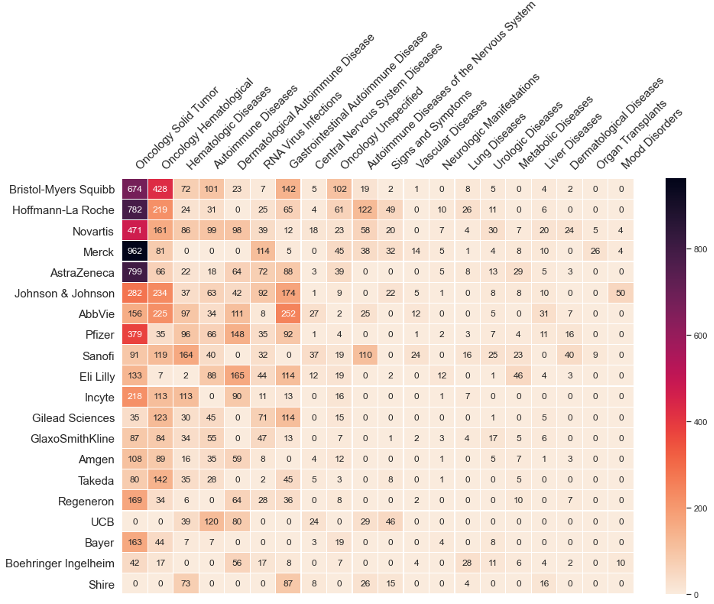
We further provide our proprietary pipeline value index that assigns a max value potential to each pharmaceutical drug in development based on the primary treatment, its novel status, the scientific focus, unmet need of the disease area it is being developed in, and the willingness to pay in that disease area.
As the drug proceeds through the development cycle, each trial accumulates increments of the maximum value based on how many trials it has completed and how many are typically needed for launch. This value index approach for valuing pharmaceutical drugs in development can be aggregated across all the trials for a total value at the drug, company, or disease area within a company.
By risk-adjusting this value index with the risk estimates for the probability to launch, you can have the following heatmaps for any group of companies at your fingertips. Because our data is updated daily, every view you call up is as of yesterday.
The risk-adjusted value index views by disease area and stage of development, making it straightforward to find the most compatible small to mid-sized pharmaceutical companies for “filling the gaps” in a larger company’s R&D pipeline portfolio.
Risk-Adjusted Value Index Score by Stage of Development and Company
Get Started with LENZ
We synthesize and process insights, delivering what you need quickly, effectively, and efficiently.
600 Warren Ave,
Spring Lake, NJ 07762