
The Challenges with Predicting Catalyst Events
“Chasing headlines” for catalyst events in the biotech and pharmaceutical markets is a common frustration of investing in these spaces. Predicting these headlines in advance is a primary goal, along with mastering the complexities of these markets so a more informed investment strategy can be made.
Clinical trial data can be a powerful tool to assist in these predictions when aggregated across specific groupings, such as for a single company, group of companies, or disease areas. Once aggregated and enhanced, this data can easily uncover emerging trends in a company’s strengths and strategy, as well as trends in the treatment of a disease and the likelihood of the standard of care changing in the next few years for those patients.
While clinical trial data can provide a treasure trove of information about companies and their treatment of diseases – with most of it being publicly available – it is often not organized or captured in a manner to facilitate aggregation at the company or disease level. Company names, drug names, and disease descriptions are all unstandardized. Neither the drug’s primary mechanism of action (the biological pathway in which the drug works) nor the drug’s commercial approval status are required information.
To rectify this, most investors spend large amounts of time and money retrieving this data from its various sources and correcting any errors, omissions, or repetitions. Typically, this process requires multiple data analysts to extract, clean, and store the data in a ready format, and it delays the flow of this information into investment decision-making. Only after all this is done can the data be properly analyzed.
A Review of Conventional Catalysts Used by Today’s Investors
Outside of the cost and time-intensive process of retrieving and preparing the data, there are other challenges investors face. We’ve discovered that some of the conventional catalysts used to identify opportunities in pharmaceutical stocks have limitations that make them unreliable models for evaluating the risk associated with investing in a pharmaceutical or biotech company.
Below is a breakdown of some of the common catalysts, any associated limitations, and how OZMOSI addresses them via our pharmaceutical intelligence platform.
Traditional Catalyst Events in Pharmaceutical and Biotech Investing
Earnings Reports – For larger pharmaceutical companies, the resulting impact of these reports is more balanced between the current sales and the company’s pipeline. With a clean clinical trial data feed, a pipeline fitness report for every company can be available at your fingertips. When this data is aggregated from the clinical trial level, as OZMOSI provides with BEAM, every reported clinical trial outcome can be easily understood in the context of the impact on that company.
Clinical Trial Results and Outcomes –This is one of the more difficult catalysts to predict because we need to predict a) the likelihood of the trial’s success, b) the impact of that trial relative both to the marketplace and the most challenging, c) when we expect to hear these reports. However, multiple investment strategies, both short and long, can be applied using this catalyst. OZMOSI can provide all the raw information needed for these, as well as specific performance estimates relative to the market for every trial with a greater than 60% accuracy in each of the last 10 years. Additionally, we are the only ones to provide a clinical trial outcome reporting date that is based on recruitment estimates and primary endpoint timing.
Mergers & Acquisitions – One of the greatest impacts on the value of a small- to mid-sized biotech company is being acquired. Pipeline fitness reports aggregated from clinical trial data can be applied both to larger companies making acquisitions as well as to smaller companies being acquired. With both in hand, any number of approaches can be taken for predicting the best company pairs in terms of complementary profiles and the likelihood of a deal transacting.
A New Catalyst to Consider
OZMOSI’s data team uncovered a new catalyst during our analysis of conventional catalysts. The impact of a clinical trial start – and how performance predictions can be applied from it for short-term investments – was discovered during the process of developing another catalyst prediction model related to the outcomes of clinical trials, described in item two above.
Clinical Trial Starts – In many cases, the scan across the clinical trial period for relative stock performance peaks found that these peaks often occurred very early in the clinical trial period, typically within the first 28 days, but most often within the first 17 days. After further analysis, our team at OZMOSI determined that this phenomenon was quite predictable and that the timing was much easier to predict than the timing for reported outcomes. Just like our predictions for the relative stock price impact of trial completions, our predictions of “outperform” and “underperform” for clinical trial starts have been more than 70% accurate for each of the last 10 years in back-testing.
How We Use Data to Address the Clinical Trial Start Catalyst Events
Our data is refreshed daily with new clinical trials – as well as updates to ongoing trials – and then processed to provide a clean version of the data elements described above and many more. Once processed, this data can be aggregated at the company level to provide a clear picture of every pharmaceutical company’s development pipeline.
For every clinical trial, we provide the original data as it exists in the clinical trial registry, as well as the additional processed data elements and model predictions. The process captures and stores not only every clinical trial but also every version of that trial. With an average of ten versions for each clinical trial, this data is ideal for developing any number of machine-learning approaches for outcome prediction. The potential use cases for this data in modeling, prediction, and data reporting are boundless.
Introducing RSPTS – Relative Stock Performance of Trial Starts
For our trial start catalyst predictions, our data contains roughly a half dozen new trial announcements every day with a company-based prediction of relative stock performance based on the trial start and a confidence interval for that prediction. Our predictions model is trained using a subset of data from our database in combination with company stock information.
A Grid Search meta-estimator from the Scikit-Learn library simulates all possible parameters in search of the best approach for our Random Forest Classifier model. Our models are updated regularly and cataloged to maintain a point-in-time reference. In general, the importance of features remains stable across models. In order of importance from greatest to least, the data elements with the highest relevance to the model are the length of the clinical trial, the company conducting the trial, disease area, phase, and company stock price trend the week prior to trial start.
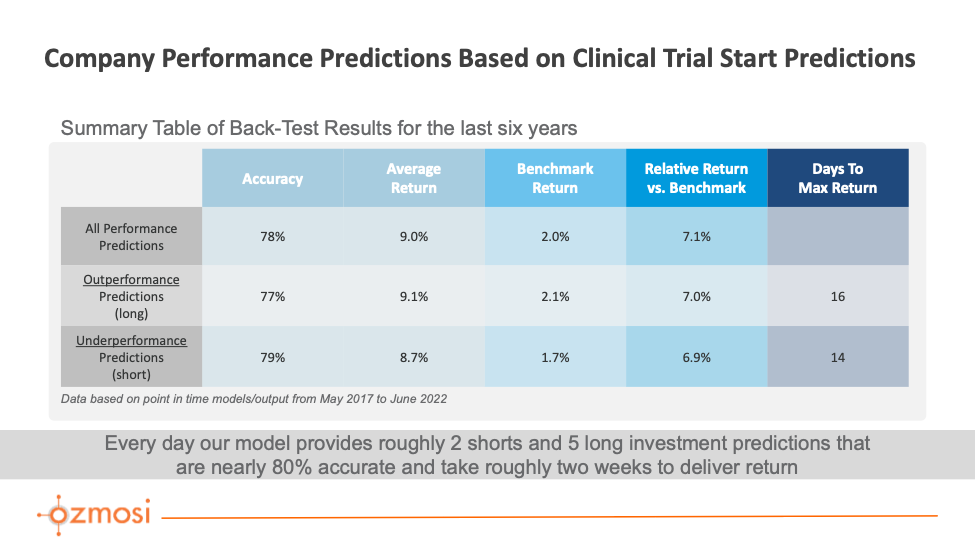
Typically, most of these predictions trend towards “outperforming” the market, and this outperformance has been the primary focus of our research to date. However, there are opportunities to explore underperformance predictions when used alone or in combination with other models.
Conclusion
For pharma and biotech companies, particularly smaller ones, the bulk of their earnings reports are focused on the clinical progression of their potential products. Depending on the number of products they have in development and other factors related to the disease areas of their products, these clinical outcomes can have a significant short- to medium-term impact on their stock price.
While there is certainly a good deal of noise and external influences on stock prices for pharmaceutical and biotech companies, there are also several clear and predictable catalyst events that occur with reliable frequency when applying the appropriate alternative data for this marketplace. Using RSPTS and OZMOSI’s next-generation data and analytics capabilities, our clients can identify and proactively prepare for catalyst events, giving them insight and an advantage when developing budget forecasts, building out pipelines, and expanding portfolios that will outperform the pharmaceutical and biotech markets.