Our comprehensive analysis of over 30,000 clinical trials across more than 4,000 biopharmaceutical companies reveals significant variations in clinical trial success rates. This disparity exists even among trials in the same phase and targeting the same disease, indicating that some companies excel in managing successful clinical trials. In this post, we delve into the factors that drive these differences, focusing on company experience and trial design strategies.
Understanding Clinical Trial Success Rates
While a company’s experience within a specific phase or disease area contributes to higher trial success rates, it is not the sole determinant. The design of clinical trials—including trial length, patient enrollment numbers, and the use of lead trials versus comparator trials—plays a crucial role in influencing the probability of success (POS). Our previous post, Not Your Grandparents’ Probability of Success Forecasts, highlighted that clinical trial elements account for 27% of predictive power, compared to just 9% for company experience. This blog post will explore how trial design strategies differ across companies and how these variations impact clinical trial outcomes.
Experience Alone Does Not Explain Success: Type 2 Diabetes Trials
To illustrate our findings, we analyzed phase 1 clinical trials targeting Type 2 diabetes conducted by leading companies: Novo Nordisk, Eli Lilly, and Pfizer. The results were revealing:

Table 1. A simple comparison of phase 1 Type 2 Diabetes shows that Pfizer significantly underperformed compared to Novo Nordisk and Eli Lilly. To explore why, we first examined each company’s previous experience in conducting trials targeting Type 2 diabetes.

Table 2. Previous experience, measured by the number of earlier phase 1 Type 2 Diabetes trials, was similar across the three companies. Novo Nordisk had a slight advantage, but this difference did not fully account for Pfizer’s poor performance.
Our analysis showed that Novo Nordisk conducted fewer lead trials (9%), which are typically riskier and have lower success rates, compared to Pfizer and Eli Lilly (both around 28%). Additionally, Eli Lilly’s phase 1 Type 2 diabetes trials were designed for longer durations and larger patient enrollments, positively influencing success rates. This suggests that Pfizer’s approach may prioritize cost-saving strategies, potentially impacting their overall success rates.
In phase 2 Type 2 diabetes trials, Pfizer continued to underperform, achieving a success rate of only 17% compared to Novo Nordisk and Eli Lilly:

Table 3. Comparison of completed phase 2 Type 2 Diabetes clinical trials and performance as measured by success rate.
This trend raises questions about Pfizer’s trial design and execution strategies in this therapeutic area.
Differences in Trial Design Drive Outcomes: NSCLC Phase 2 Trials
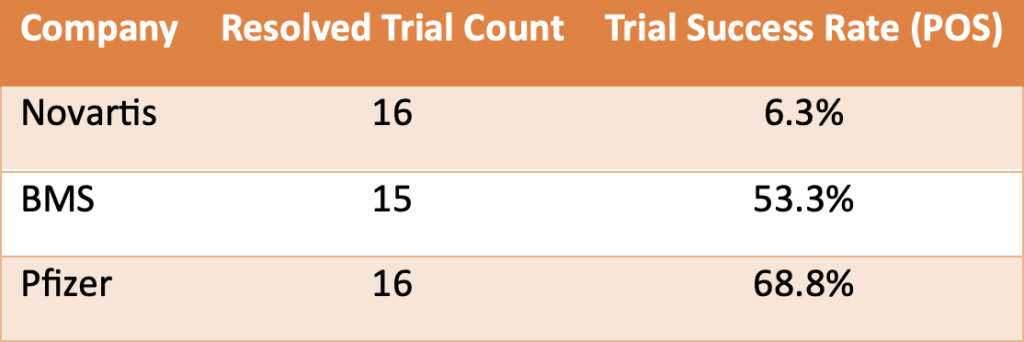
Next, we examined phase 2 clinical trials for non-small cell lung cancer (NSCLC) conducted by Novartis, Bristol-Myers Squibb (BMS), and Pfizer. The differences in trial success rates were notable:

Table 4. Despite similar experience levels in Phase 2 clinical trials for non-small cell lung cancer (NSCLC), Novartis dramatically underperformed compared to both BMS and Pfizer.

Table 5. Basic trial design metrics across three companies in Phase 2 clinical trials for NSCLC.
BMS achieved higher success rates by enrolling significantly more patients and frequently using active comparators, both of which are associated with increased trial success. Comparator trials, where investigational drugs are tested against existing treatments, provide robust data on drug efficacy, contributing to BMS’s strong performance.
Conversely, Pfizer’s strategy of avoiding combination therapies, which typically have lower success rates in phase 2 NSCLC trials, played a crucial role in their performance. Nearly half of Novartis’s investigational drugs were combination therapies, while Pfizer limited this to just 25%, significantly impacting their success rate.
Conclusion
Experience alone does not fully account for clinical trial success; the design of the trials is equally crucial. Our analysis underscores the importance of considering both company-level data and clinical trial-level data to accurately forecast clinical trial success. Understanding nuances such as planned trial length, patient enrollment, and other design elements is essential for improving outcomes.
At OZMOSI, we leverage our industry-leading methodology to convert clinical trial information into a clean taxonomy and model-ready data, providing unprecedented access to critical trial-level data. This enables us to offer deeper insights into clinical trial performance.
By combining our expertise in trial design with company-level data and proprietary analytics, we help clients build accurate and customized POS models. Incorporating both fundamental and sophisticated trial design elements—such as endpoints, inclusion criteria, and biomarker strategies—allows us to provide the insights necessary to optimize your clinical development programs.
Interested in learning more about how your company can improve clinical trial outcomes? Contact us to discuss how we can tailor a POS model specifically for your organization.
