

Financial statements show how much pharmaceutical companies spend. Clinical trial data reveals whether that investment is building future pipeline value.
Introduction
Financial statements tell us how much pharmaceutical companies spend. Clinical trial registries tell us what they are developing. Individually, both datasets provide valuable perspectives. Together, they reveal how the business of pharmaceutical innovation has fundamentally changed.
To better understand these changes, we combined ten years of financial data from 21 of the world’s largest pharmaceutical companies with their global clinical trial activity. The financial dataset spans 2016 through 2025 and includes revenue, R&D expense, and SG&A expense collected from SEC filings and standardized into U.S. dollars. The clinical dataset covers the same period and tracks trial initiations, ongoing studies, completed trials, clinical phase, and patient enrollment. All of this data is now available for your review as well here: https://superb-malabi-8f71af.netlify.app/
Rather than evaluating companies in isolation, the objective was to identify broader industry trends. How are research investments changing? Are companies becoming more efficient? Does higher R&D spending actually translate into more clinical development? And perhaps most importantly, what metrics best predict future competitive positioning?
Several themes emerge from the data. Some confirm long-held assumptions about the industry, while others challenge them entirely.
Pharmaceutical Companies Continue to Shift Investment Toward Innovation
Perhaps the clearest long-term trend is the continued reallocation of capital away from commercial infrastructure and toward research and development.

Figure 1. SG&A and R&D spend as a percentage of revenue based on annual financials reported in 10-K and 20-F filings.
When we examine the spending on R&D vs. SG&A as a percent of revenue across the companies analyzed, R&D spending increased from approximately 18% of revenue in 2016 to roughly 21% by 2025. During the same period, SG&A expenses declined from approximately 26% to below 22% of revenue. Around 2023, research spending caught up with the cost of selling for the first time in the dataset.
Importantly, these figures represent revenue-weighted averages rather than simple company averages, preventing smaller biotechnology companies from disproportionately influencing industry-wide conclusions.
The decline in SG&A is remarkably consistent across the sector.
- Eli Lilly reduced SG&A from roughly 30% of revenue to 17%
- Bristol Myers Squibb declined from approximately 25% to 15%
- Merck fell from about 25% to 17%
While individual strategies differ, the overall direction is unmistakable. The pharmaceutical industry is steadily allocating a larger share of every revenue dollar toward creating future products rather than selling existing ones.
Reported R&D Growth Only Tells Part of the Story
One interesting trend becomes apparent when acquisition-related accounting adjustments are removed from reported R&D expenses.
Under U.S. accounting rules, acquired in-process research and development can be recognized immediately as R&D expense, even though that spending did not originate from internal research organizations. As a result, reported R&D can increase dramatically without any corresponding increase in laboratories, scientists, or clinical development.
Across the companies analyzed, acquisition-related charges contributed approximately $82 billion to reported R&D over the past decade, with nearly $47 billion occurring between 2023 and 2025 alone.
Merck illustrates this effect clearly. Reported R&D reached roughly 51% of revenue during 2023. Excluding acquisition-related charges reduces underlying R&D to approximately 32% of revenue. AbbVie’s reported 2025 R&D ratio similarly falls from roughly 23% to approximately 15% after adjustment.
This does not diminish the strategic importance of acquisitions. Acquiring innovative science is itself an important component of pharmaceutical R&D strategy. Rather, it demonstrates that increases in reported research spending may reflect a combination of internal innovation and external portfolio acquisition.
Understanding that distinction becomes increasingly important when evaluating long-term investment trends.
The Economics of Drug Development Have Fundamentally Changed
The most significant finding emerges only after financial data is analyzed alongside clinical trial activity.
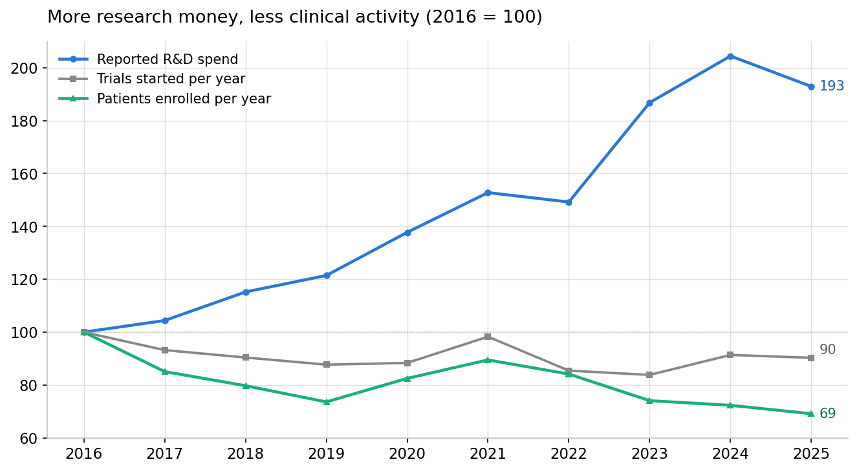
Figure 2. Reported R&D spend and clinical activity as a proportion of 2016
Between 2016 and 2025, reported R&D spending across the cohort nearly doubled—from approximately $85 billion to $164 billion.
Yet over the same period:
- Annual trial initiations declined by roughly 10%.
- Total patients enrolled in clinical studies declined by approximately 31%.
At first glance, these figures appear contradictory. In reality, they reflect a fundamental transformation in pharmaceutical research.
Some of the increase is explained by acquisition accounting. However, a much larger structural trend is also occurring.
Drug development has increasingly shifted toward precision medicine, where therapies are designed for smaller, biologically defined patient populations rather than broad disease categories.
Modern oncology provides perhaps the clearest example. Rather than studying all lung cancer patients together, companies increasingly develop therapies targeting individual biomarkers such as EGFR, ALK, KRAS, HER2, ROS1, or MET alterations. Similar approaches are expanding rapidly across immunology, rare diseases, neuroscience, and other therapeutic areas.
These programs typically require:
- Sophisticated genomic and biomarker testing,
- Companion diagnostics
- More complex trial designs
- Global patient identification
- Adaptive study methodologies
- Specialized manufacturing
- Significantly higher operational costs per enrolled patient
As a result, pharmaceutical companies are spending substantially more while enrolling substantially fewer patients.
In other words, today’s research dollars purchase fewer clinical trials—not because companies are becoming less productive, but because the science itself has become dramatically more sophisticated.
This shift toward personalized medicine represents one of the defining trends shaping pharmaceutical R&D over the next decade and fundamentally changes how investors, competitive intelligence teams, and corporate strategists should interpret research spending.
Financial Statements Alone No Longer Explain Pipeline Strength
This evolution in R&D economics creates an important challenge for industry analysis.
Traditional financial metrics increasingly fail to distinguish between companies investing heavily in productive clinical development and those whose reported R&D growth is driven primarily by acquisitions or accounting events.
The combined financial and clinical dataset helps separate those stories.
For example, AstraZeneca and Gilead both report R&D spending near or above 23% of revenue during 2025. Viewed solely through financial statements, they appear remarkably similar.
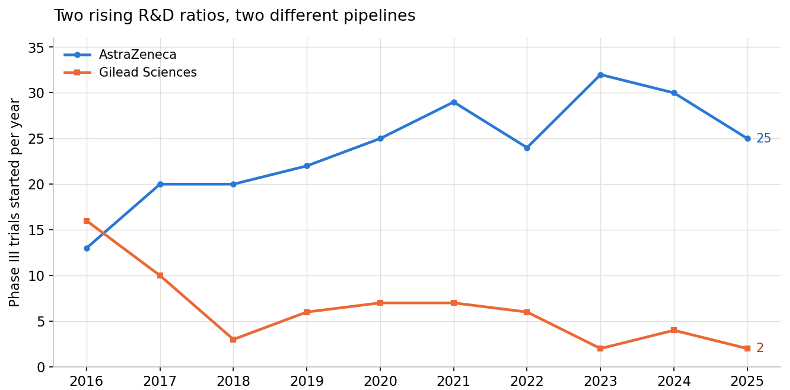
Figure 3. Comparison of Phase 3 clinical trial starts for two companies with similar R&D allocations
Their pipelines tell a different story.
AstraZeneca’s late-stage trial initiations roughly doubled over the decade, increasing from approximately 13 annually to a peak of 32. This suggests that rising research investment is translating into expanding clinical development and a larger portfolio of future product launches.
Gilead followed a very different trajectory. Despite maintaining high reported R&D spending, late-stage trial initiations declined substantially—from 16 in one year to only 2.
Neither financial statements nor clinical trial registries independently reveal this distinction. Over the past decade, AstraZeneca has maintained more than seven times as many Phase 1 clinical trials as Gilead, while Gilead has experienced a steady decline in Phase 2 and Phase 3 trial starts over the same period. This contrast in clinical activity highlights AstraZeneca’s sustained investment in early-stage development and its ability to maintain a broader pipeline of programs advancing toward late-stage development is not readily apparent in the financial statements alone. The combination of greater early-stage scale and stronger R&D productivity has translated into a larger Phase 3 portfolio for AstraZeneca, supporting a more sustained pipeline of potential product launches and growth overall.
Only by evaluating spending alongside development activity can analysts determine whether increased R&D represents:
- Expanding internal innovation
- Acquired assets
- Portfolio replacement
- Declining pipeline productivity
As personalized medicine continues increasing development costs, this type of integrated analysis becomes increasingly essential for evaluating company value.
Identifying the Companies Converting Investment into Future Growth
The combined dataset also highlights organizations consistently translating research investment into long-term competitive advantage.
Several companies stand out not because they spend the most, but because multiple indicators align:
- Sustained investment in internally generated R&D
- Disciplined reductions in SG&A
- Expanding clinical pipelines
- Strong long-term revenue conversion
AstraZeneca represents one of the clearest examples, combining increasing late-stage clinical activity with consistently elevated research investment and disciplined commercial spending.
Eli Lilly and Novo Nordisk illustrate another important pattern. Although their R&D ratios remained relatively stable over much of the decade, their absolute research spending increased dramatically as revenues expanded. Stable percentages can therefore mask enormous increases in real research investment.
Both companies also demonstrate exceptional five-year R&D-to-revenue conversion, indicating that historical research spending has translated efficiently into current commercial performance.
These comparisons illustrate why evaluating pharmaceutical companies requires more than ranking R&D budgets. The interaction between spending, pipeline activity, therapeutic focus, commercialization strategy, and long-term revenue generation provides a much more complete picture of competitive positioning.
This broader benchmarking framework also highlights emerging strategic themes across therapeutic areas. One particularly striking example is the industry’s accelerating investment in obesity and metabolic disease, where companies are committing unprecedented levels of research capital to compete in what may become the largest pharmaceutical market of the next decade. Which companies are investing and which ones are not? We will explore that competitive landscape in greater detail in our following analysis.
R&D Spending Has Nearly Doubled: Understanding Company Value Now Requires Looking Beyond Financial Statements
Perhaps the most important conclusion from this analysis is not simply that pharmaceutical companies spend more on research than they did ten years ago.
It is that financial statements alone no longer provide enough information to evaluate innovation.
Over the past decade:
- Industry R&D spending has nearly doubled
- SG&A has steadily declined
- Clinical trial activity has become smaller, more targeted, and more expensive
- Precision medicine appears to have fundamentally changed the economics of drug development
- Acquisition activity increasingly influences reported R&D
- Two companies with nearly identical financial metrics can have dramatically different future pipelines
As pharmaceutical development becomes increasingly complex, understanding company value requires connecting financial performance with scientific execution.
Explore the data yourself
Everything in this post comes from the dashboard, and there is more in it than one post can cover. You can filter by company and year range, chart revenue, R&D, or SG&A over time, view R&D and SG&A as a percentage of revenue for every company, browse trial activity by phase, and see flags on the companies where acquisition charges inflate the R&D line. All figures trace back to SEC filings and public trial records.
Access the data here: https://superb-malabi-8f71af.netlify.app/