The leaders, the contenders, and the strategies for success
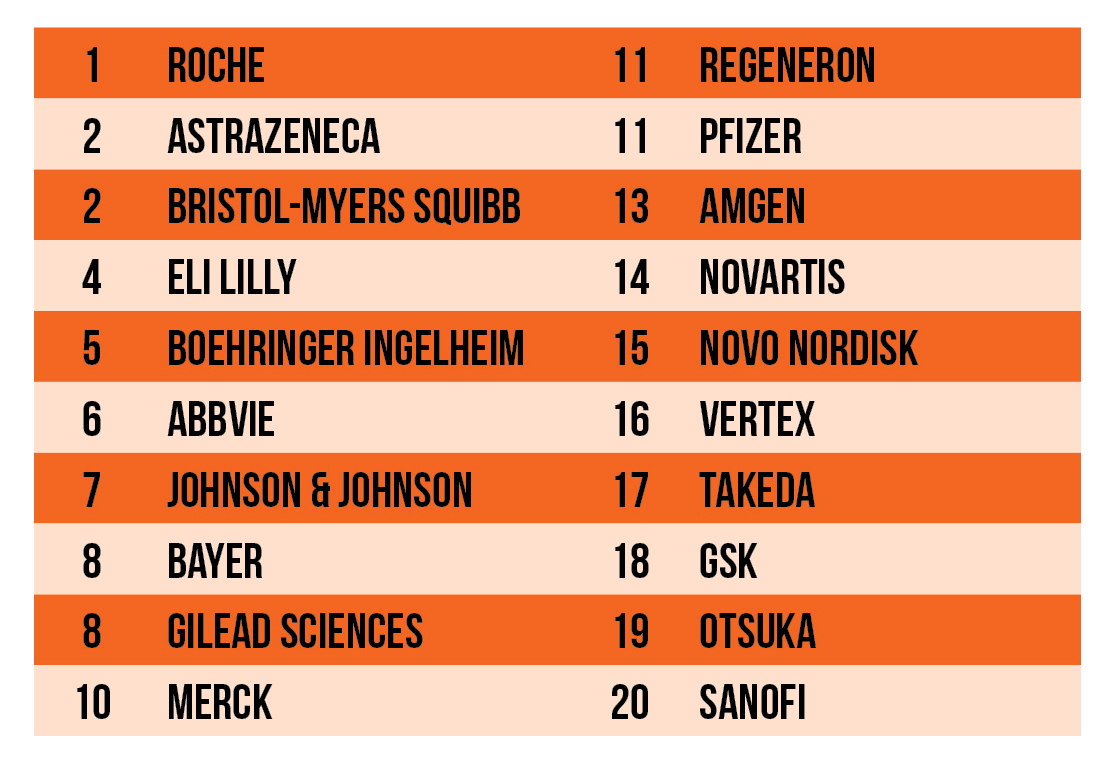
As we approach the 4th quarter of 2025, let’s review where the pharmaceutical industry’s leading companies rank in terms of overall pipeline strength.

Roche, AstraZeneca, and Bristol-Myers Squibb sit in a comfortable position at the top of the rankings. Their high positions are due to a combination of portfolio breadth and depth in strategic areas, in addition to a solid balance between innovation and risk management.
Eli Lilly, AbbVie, and Johnson & Johnson are within striking distance, however. They could catch up to the leaders by pursuing new M&A opportunities and/or capturing wins by maturing their existing pipelines.
Innovation leaders Boehringer Ingelheim, and Regeneron may be well positioned for growth in the coming years. In contrast, Merck, Amgen, and Pfizer would be wise to consider acquiring or licensing new treatments from more innovative, mid-sized companies to strengthen their pipelines.
The science behind our clinical trial predictions
As a pioneer in automating clinical trial data collection, OZMOSI was the first to meaningfully incorporate AI and machine learning into data refinement and categorization. This enables us to deliver exceptionally clean—and uniquely straightforward—portfolio views of key pharmaceutical companies and their R&D pipelines.
This ranking was generated using LENZ, our industry pipeline portfolio analysis tool that highlights trends and categories in patient segments, MOAs, and disease areas across the pharmaceutical R&D clinical landscape. LENZ pulls data directly from BEAM, our clinical trial tracking and reporting database, which is updated daily with the most current clinical trial data from across the globe.
LENZ, our industry pipeline portfolio analysis tool, highlights trends and categories in patient segments, MOAs, and disease areas across the pharmaceutical R&D clinical landscape.
We then applied our proprietary value index, which predicts a trial’s chance of progressing through each phase and ultimately gaining regulatory approval. To establish a trial’s value, we first look at the disease it treats and the treatment being tested, and assign a potential value from 0 to 100 by weighing four key factors:
- The disease’s public health burden as measured by disease-adjusted life years (DALYs)
- Willingness to pay for treatments in this disease area derived in part from Medicare reimbursement data
- How much scientific attention the disease is getting, based on the number of active/planned trials
- The recent growth of trial activity in the disease area, as measured by the percentile from 3 minus the percentile of completed trials in this disease area
Next, we organize all trials by their start date; the earliest trial receives the most value, with subsequent trials assessed and lesser and lesser value. We also assess novel treatments at a higher value than those already approved.
Our advanced probability-of-success (POS) forecasting model uses the support vector machine (SVM) algorithm, a machine-learning technique that is particularly effective in classification. We apply a variety of predictor variables to generate estimates of each trial’s likelihood of reaching a successive phase of development. In many cases, therapy areas are modeled separately to allow for higher accuracy in determining the following model factors:
- The trial’s disease area
- Treatment attributes, such as its novelty
- The sponsoring company’s experience in that disease area
- Trial design elements, e.g., a comparator study
Individual trial estimates are then aggregated at the treatment- and disease-area level and compounded across the full development cycle to arrive at a probability of technical and regulatory success (PTRS) estimate.
The four pillars of pipeline strength
When we analyze the risk-adjusted value across companies, therapy areas, and development phases, we assess the following four key elements that, added together, represent the overall strength of a company’s pipeline:
- Total Value: An assessment of the total value of a company’s pipeline based on its potential to impact patients. It represents the combined risk-adjusted value of every drug in the company’s pipeline.
- Risk: The risk in a company’s pipeline, measured by comparing its risk-adjusted value to its raw value. This score reveals how likely a company is to achieve its full potential, and often reflects the company’s level of innovation; a riskier portfolio may signal a focus on groundbreaking new treatments rather than established development trends.
- Innovation: A measure of a company’s potential for blockbuster impact on a marketplace based on how much of its pipeline consists of novel, potentially game-changing treatments compared to existing treatments that only offer small improvements.
- Pipeline balance: The measure of the balance of a company’s pipeline between early- and late-stage projects. An ideal pipeline has a steady stream of early-stage (Phase 1) assets to ensure a continuous flow of products. A healthy balance is roughly 65% to 75% in early development.
Breaking down the Top 20’s pipeline strength in 2025
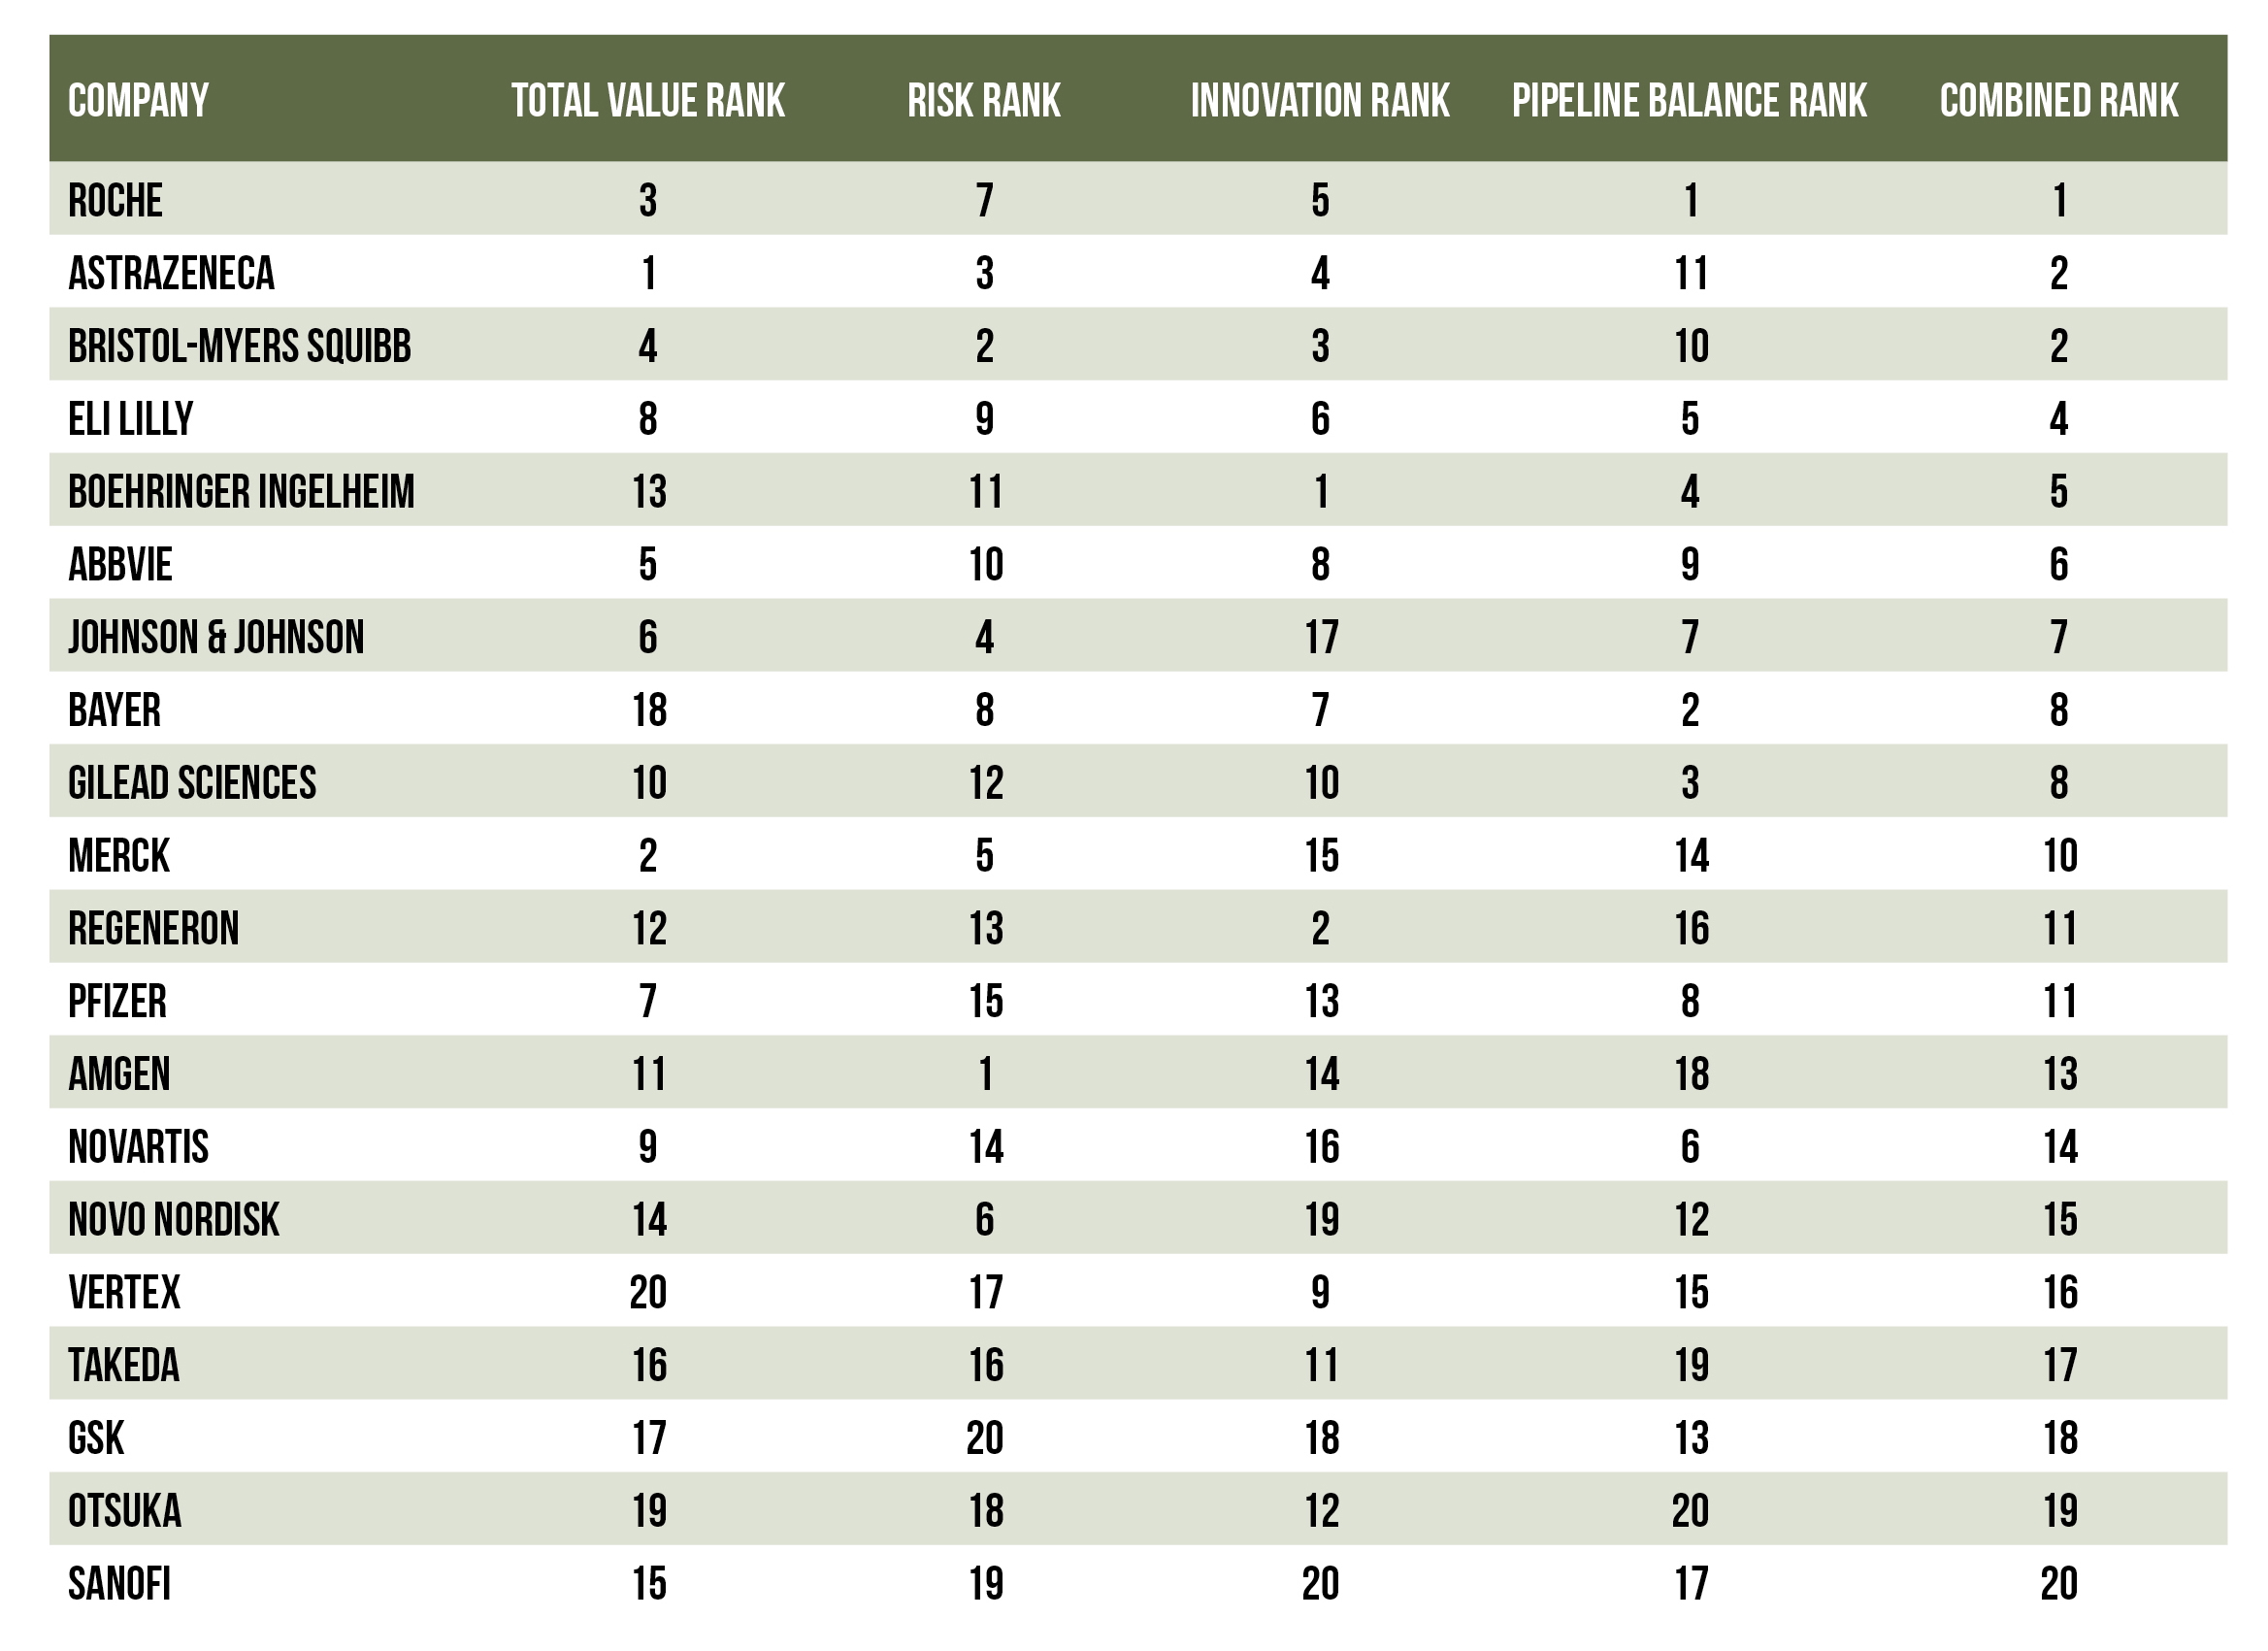
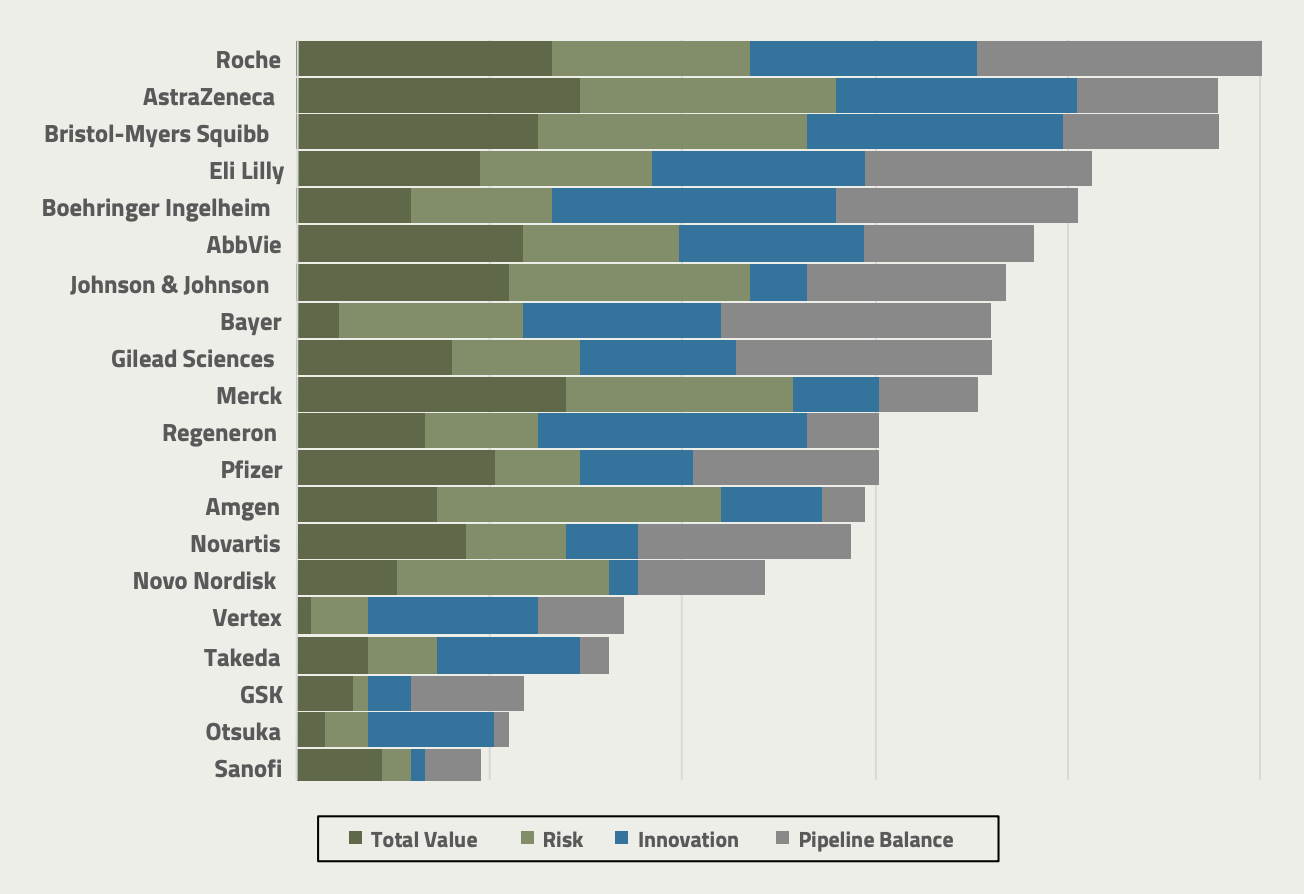
Below is a breakdown of how the Top 20 companies stack up across these four key measures. Overall, Roche leads the way with strength across all four key scores. AstraZeneca and Bristol-Myers Squibb are a close second; their only potential weakness is a late-stage tilt. Merck has strong value potential, but it shows signs of concentration risk with pembrolizumab; it may need to add more innovation and early-stage balance to its portfolio.
Eli Lilly, AbbVie, and Johnson & Johnson are all strong in most of these categories, but each could use either additional value, innovation, or risk management for their portfolios. Boehringer Ingelheim and Regeneron show significant innovative potential, but that potential has yet to be realized. Takeda, GSK, Otsuka, and Sanofi are struggling along most of these elements.


The top companies in terms of overall risk-adjusted portfolio value are oncology heavyweights AstraZeneca, Roche, and Merck. However, companies like Bristol-Myers Squibb, AbbVie, and Johnson & Johnson are also strong contenders along this dimension. In contrast, companies like Bayer, Sanofi, GSK, Otsuka, and Takeda are falling short of their peers in terms of total value, which is perhaps due to a weaker presence in high-value areas like oncology and neuroscience. Still, this is just the beginning of the story when it comes to the overall health of these companies’ pipelines.
The top companies in terms of overall risk-adjusted portfolio value are oncology heavyweights AstraZeneca, Roche, and Merck.
When it comes to risk and innovation, Amgen has a very favorable risk profile to its assets despite being in the middle of the pack in terms of total risk-adjusted value; however, its proportion of novel assets is low (innovation rank 14), which could explain the lower risk. By comparison, Bristol-Myers Squibb and AstraZeneca also have excellent risk profiles, but at the same time exhibit substantial innovation in their portfolios (innovation ranks 3 and 4, respectively).
Companies like Boehringer Ingelheim and Regeneron have shown strong innovation levels in their portfolio; while this has also given them considerable risk and has not yet translated to value, it could set them up very well for future success. Interestingly, GSK and Sanofi appear to struggle on both dimensions—their risk profile appears unfavorable, while at the same time their proportion of innovative assets is also relatively low. Takeda and Otsuka, however, are slightly closer to average levels of innovation.
In the category of pipeline balance, Roche adds to its overall strength with a well-balanced portfolio maturity, while companies like Merck and Amgen could be at risk of a development cliff with fairly backloaded pipelines. Merck has continued to see evergreen success with pembrolizumab, which represents nearly a third of its future value potential. However, the drug’s patent is set to expire in 2028.
Bayer and Gilead also exhibit well-balanced pipelines, albeit at a lower overall current risk-adjusted value potential than companies like Roche. However, Gilead has invested heavily in the past year in oncological trials, which could contribute meaningfully to future value. Otsuka, Takeda, and Sanofi add to their woes here with a late-stage skew and substantial gap in early development assets. GSK’s portfolio balance is only slightly below average.
Navigating the future of pharmaceutical pipelines
Balancing innovation, risk, and maturity is key for most pharmaceutical companies as they hunt for earnings growth while preserving legacy sales in a post-COVID era. While specialized value hotspots—like the GLP-1 race in obesity and the growing immuno-oncology (CAR-T) market—will continue to emerge, having a broad presence across the key therapy areas of oncology, neuroscience, and immunology remains a viable approach.
These four indicators only tell a portion of each company’s story when it comes to the shape and direction of their development pipelines. In future blogs, we’ll dive into specific disease and mechanism-of-action trends to examine exactly what is driving value within the Top 20. We’ll also take a closer look at the most likely mid-sized public acquisition targets, based on how well they fit into these companies’ existing pipelines.
These four indicators only tell a portion of each company’s story when it comes to the shape and direction of their development pipelines.
Author
Joe Edelmann, CFA, has a passion for designing creative data analysis solutions to answer practical questions, identify trends, and drive decision-making. At OZMOSI, he designs custom data products and models from a variety of large data sources and provides consulting support to our clients.
About OZMOSI
At OZMOSI, we blend decades of BioPharm industry experience with fully integrated clinical trial and pipeline data analysis and reporting. Our clinical trial data is model- and dashboard-ready, with indexing that seamlessly connects daily trial updates to FDA approvals, SEC filings, and the latest news events. Through the integration of AI and machine learning, OZMOSI builds solutions that allow our customers to track BioPharm company clinical development programs more consistently and accurately than they have ever been able to do before. Through our data and catalyst-event trackers, our clients can predict BioPharm R&D headlines before they happen.
